Products
SIMPROCESS Features
Customizable Real Time Plots - Multiple Axis and Data Sets
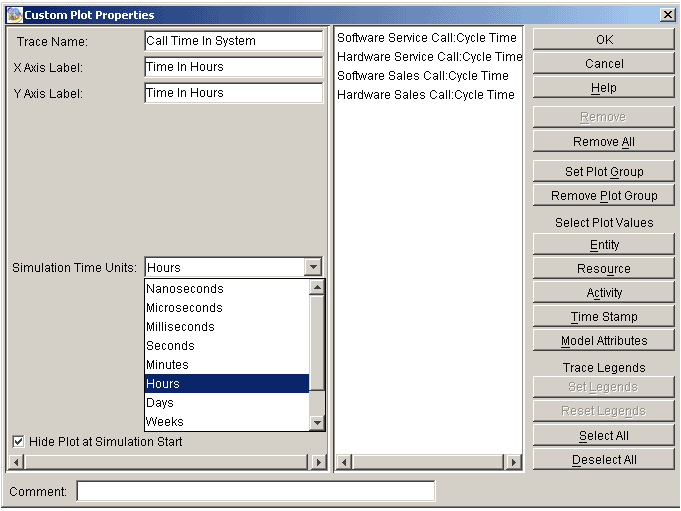
Custom Plots allow the plotting of multiple values on the same plot. The Custom Plot Properties dialog allows you to specify various characteristics for Custom Plots in your model. The left side of the dialog contains properties that can be set for any plot.
Real-Time Plot Properties Example:

Graph Name: The text entered here will be used as the plot title
X-Axis Label: The text to be used for the X-Axis legend
Y-Axis Label: The text to be used for the Y-Axis legend
Simulation Time Units: For some plots, this will allow you to specify the units of measure for the X-axis. Values may be selected from Nanoseconds, Microseconds, Milliseconds, Seconds, Minutes, Hours, Days, Weeks, Months or Years.
Value Time Units: For some plots, this will allow you to specify the units of measure for the Y-axis. Values may be selected from Nanoseconds, Microseconds, Milliseconds, Seconds, Minutes, Hours, Days, Weeks, Months or Years.
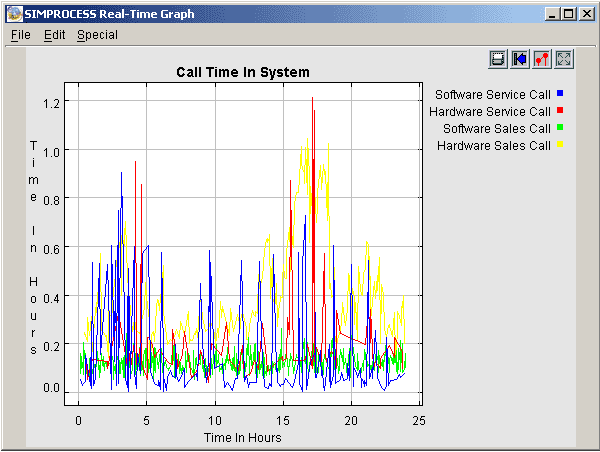
Sample graph from help desk model: Real-Time Plot Colored Calls Example
